Group by column
Grid Designer provides you with an exceptional data visualization experience. The 'Group By' icon allows users to group data by columns, offering an intuitive and powerful approach to presenting information clearly and efficiently. Discover how to transform your data into engaging and understandable reports by leveraging the grouping features that Grid Designer offers.
Create a Group By
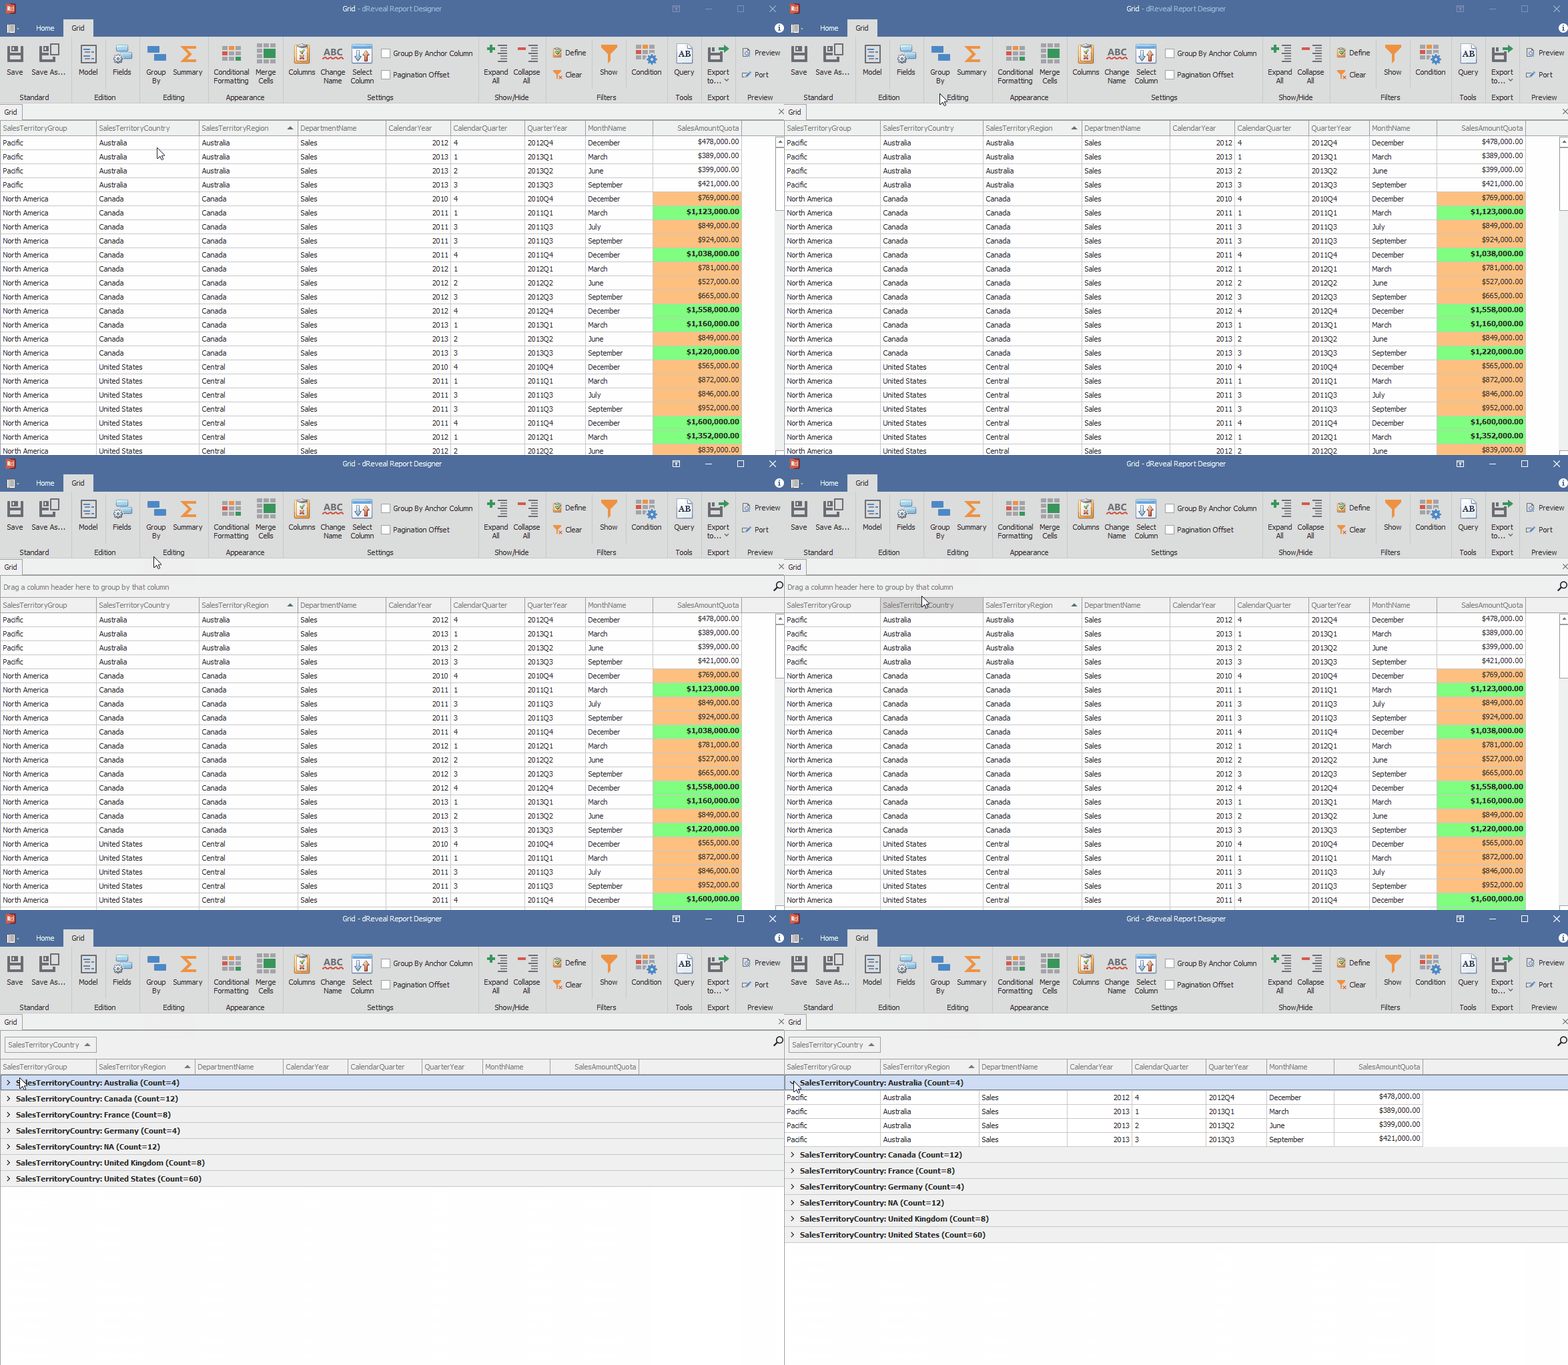
To create a "Group By," first open the Grid Designer. Then, you can create a new report or open an existing one. Next, click on the "Group By" icon. Drag and drop the "SalesTerritoryContry" column into the section that says "Drag a column header here to group by that column." Finally, expand the first group.

The most impressive aspect is that Grid Designer goes above and beyond by providing you with the flexibility you need. Have you performed groupings in your report and now need to adjust them? Not a problem. Grid Designer offers you the convenience of undoing groupings with just a few clicks.
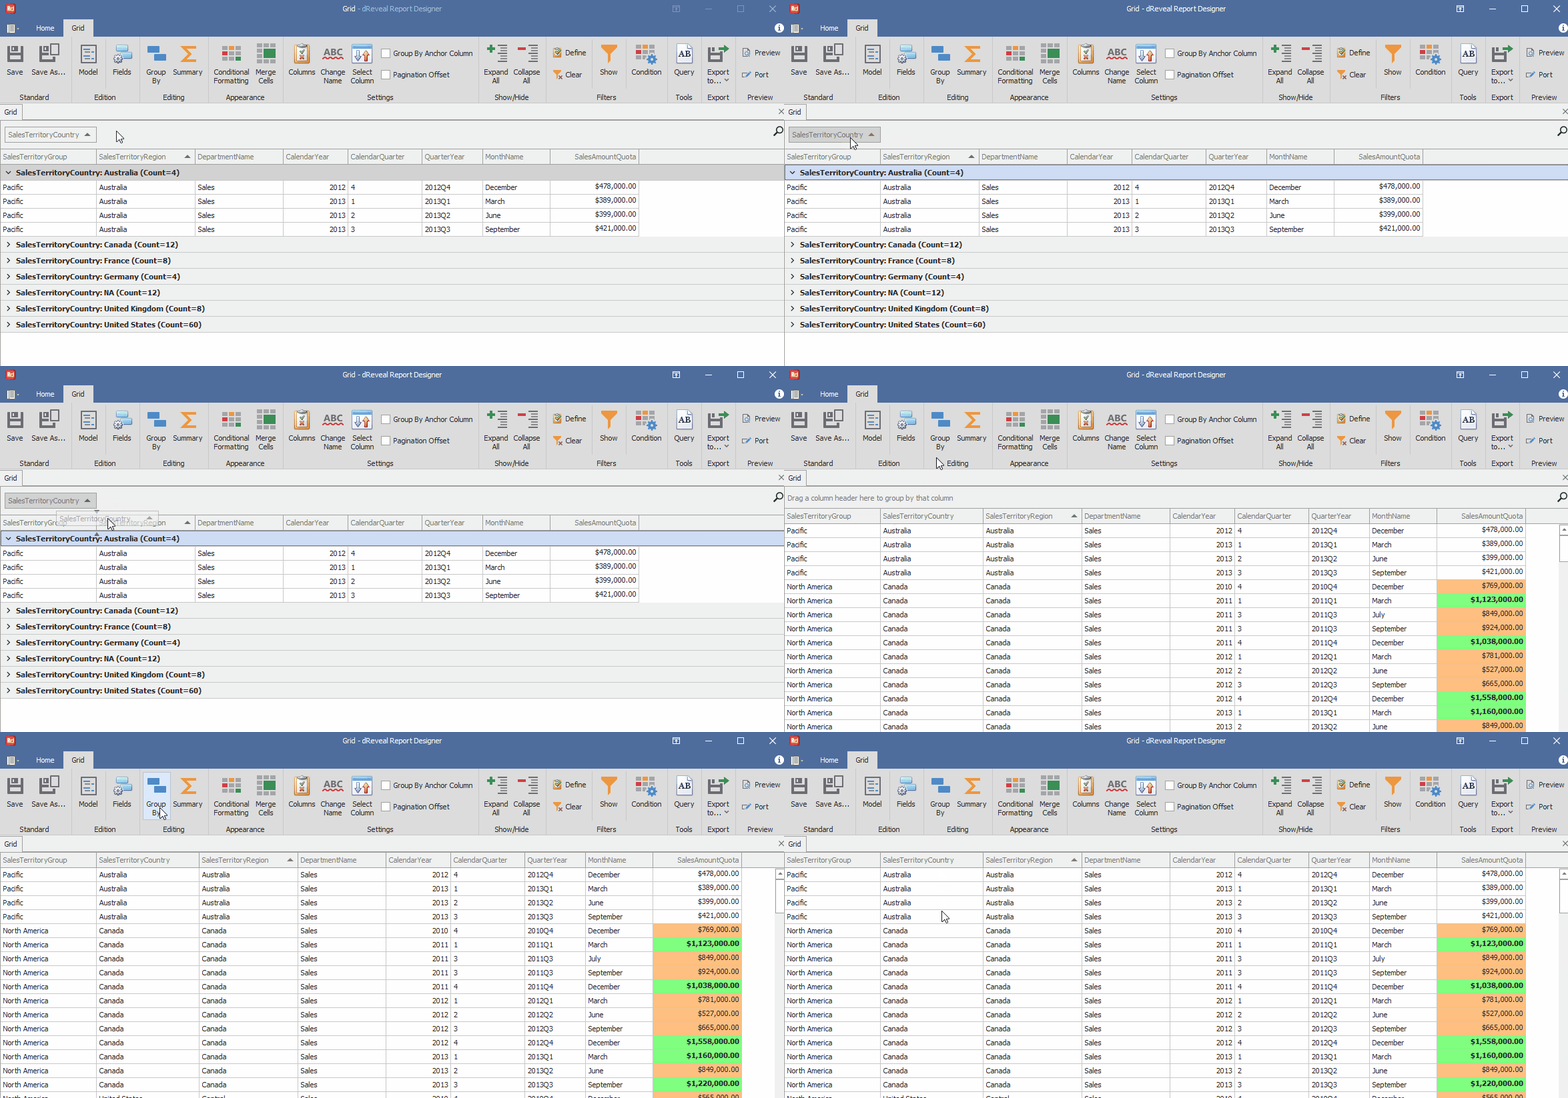
Remove a Group By
To remove a "Group By," first move the grouped column to the report header. Then, click on the "Group By" icon.

